PowerMyLearning is having a strong positive impact on academic achievement among Los Angeles schools fully participating in our program (herein called “PowerMyLearning schools”).
As shown in the bar chart below, PowerMyLearning schools outperformed comparison schools in math proficiency by an average of 8.6 percentage points each year (4.3% average annual improvement in the percent of students at or above proficiency at PowerMyLearning schools and -4.3% change at comparison schools).
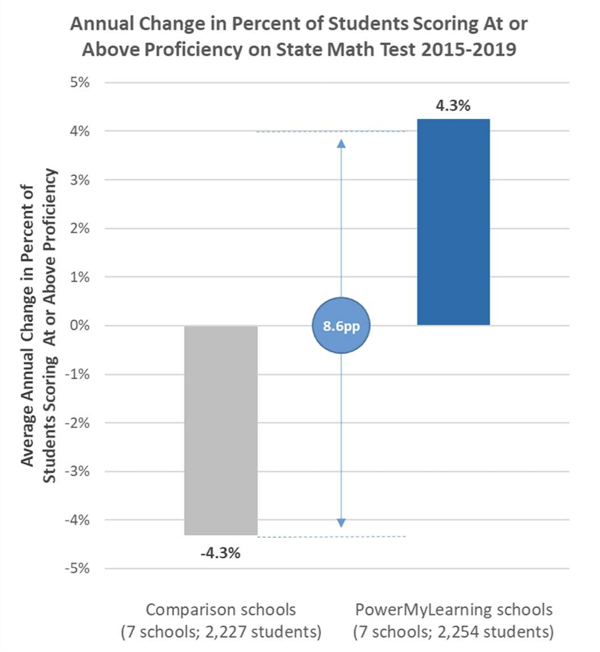
The study included the middle school grades at seven PowerMyLearning schools from our Greater Los Angeles region during four school years (2015-16, 2016-17, 2017-18, and 2018-19). At least 75% of the students at all of these schools qualify for free or reduced price lunch. Over the four school years, the PowerMyLearning program reached 2,254 students in these schools in grades 6-8.
Services Delivered in PowerMyLearning Schools:
PowerMyLearning schools in this study received the following services each school year:
- Coaching for math teachers on creating personalized learning environments through the effective implementation of blended instructional practices. Teachers received a minimum coaching dosage of 20 instructional days. In addition, teachers at some schools participated in workshops to introduce the program and the PowerMyLearning® Connect™ platform. This was over and above the coaching days allotted to each school.
- Support for school leaders, including meetings with principals and other school leadership personnel. Meetings and other interactions typically took place on a biweekly basis. Additionally, PowerMyLearning coaches shared coaching notes regularly with school leaders throughout the program and offered suggested priorities for professional development sessions.
- Family engagement services that support families in becoming learning partners with their students. Services can include providing families and students with hands-on learning workshops and/or providing school leadership with support and consulting around how to better engage families in student learning.
Study Methodology
To determine PowerMyLearning’s impact on student achievement, we used a quasi-experimental study that compared the results of PowerMyLearning schools on the statewide math test with the results from comparison schools. PowerMyLearning consulted with MDRC, a nationally recognized research organization, to ensure the validity of the comparison-school selection process.
For each PowerMyLearning school, a comparison school was selected using a two-step process that included: (1) generating a pool of comparison schools to select from, and (2) using an index to select the actual comparison school from that pool. A pool of comparison schools was generated for each PowerMyLearning school based on proximity, poverty demographics, ethnic demographics, school size, and starting proficiency:
- Proximity: The schools included in the comparison pool were all located within Los Angeles County.
- Poverty Demographics: The schools included in the comparison pool had populations wherein at least 75% of the student population received free or reduced price lunch, because PowerMyLearning used this same cutoff to select schools for its intensive program.
- Ethnic Demographics: The schools included in the comparison pool had a school-wide ethnicity profile such that the percentage of students in the most prevalent ethnic group was within 20% of the PowerMyLearning school’s percentage of students in the same ethnic group.
- School Size: The schools included in the comparison pool had grade-level enrollments within 60 students (or approximately 2 classes) of the PowerMyLearning school’s grade-level enrollment.
- Starting Proficiency: The incoming grade of the schools included in the comparison pool had a baseline proficiency level within 5% of that of the incoming grade in the PowerMyLearning school.
A composite score was then used to select each comparison school from the pool of schools identified. This composite score was created using an evenly-weighted average of the poverty demographic, the percentage of black students, the percentage of Hispanic students, school size, and starting proficiency.
The average annual change in the percentage of students scoring at or above proficiency (as shown in the first chart in this document) was calculated by finding the average of this data for all the PowerMyLearning schools and for all the comparison schools.
At the individual school level, the annual average change for each PowerMyLearning school was determined by doing calculations first at the grade level and then rolling those calculations up to the school level. So for each grade where our program reached a minimum of 85% of the students, a grade level average annual difference between a pre value and post value was calculated (as described below). These annual differences at the grade level were then combined into a school-wide annual difference by 2 using a weighted average where the weighting depended on the number of years in which we worked with each grade.
The grade-level average annual difference was calculated by subtracting the pre value from the post value and dividing by the number of years of program implementation. The pre value for a PowerMyLearning grade was the percentage of students at or above proficiency in the year prior to that grade receiving any services. The post value was the percentage of students at or above proficiency at the end of the most recent year of program implementation.
To fully understand this process, we provide an example with School X. Let us assume that PowerMyLearning worked with School X for four years, serving the sixth grade for four years starting in 2015-16 and serving the seventh grade for three years starting in 2016-17. Starting with the sixth grade, the pre value would be the sixth-grade proficiency in 2014-15 (the year immediately preceding PowerMyLearning’s implementation) and the post value would be the sixth-grade proficiency in 2018-19 (the most recent year of program implementation). The average annual difference for this grade would be post value minus the pre value divided by four. Moving to the seventh grade, the pre value would be the seventh-grade proficiency in 2015-16 and the post value would be the seventh-grade proficiency in 2018-19. The average annual difference for this grade would be the post value minus the pre value divided by three. Moving to the school level, the average annual difference for School X would be the weighted average of sixth grade and seventh grade annual average differences whereby the sixth grade number receives four-thirds the weighting of the seventh grade number (since the sixth grade received services for four years and the seventh grade for three years).